The Lighthouse Preview

When Credit Stops Believing

Large technology companies have committed enormous sums to build AI data centers. Recently, the cost of protecting some of their debt against trouble has risen. Similar warning signs appeared before the major market declines that followed the late-1990s technology boom and the 2007 housing boom. That does not predict the same ending, but it explains why this deserves attention now.

Why this matters now

In July, LSEG data reported by the Financial Times showed credit-default-swap prices tied to Oracle, SpaceX, Alphabet, Amazon, Meta, Broadcom, and Nvidia rising to record highs. The concern is not that history must repeat. It is that credit is again repricing risk before the equity story has clearly broken.

The historical echo

Credit moved first in 2007—and during the late-1990s market cycle.

Federal Reserve materials from August 2007 recorded widening investment-grade, high-yield, and global CDS spreads as mortgage conditions deteriorated. A CME review of the 1990s and 2003–2007 bull markets likewise found that credit spreads began widening before equities reached their peaks.

That sequence gives this report its relevance: stress can become visible in the cost of money before it becomes obvious in stock prices or the economy. It is an invitation to pay attention—not a declaration that a crash date has been identified.
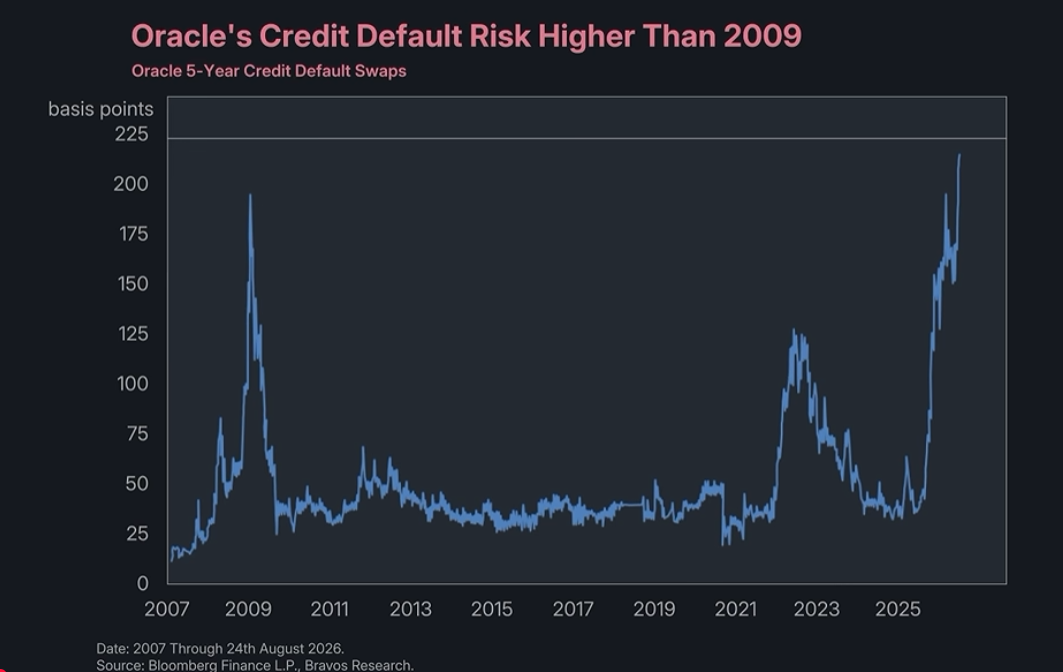
Line chart of Oracle five-year credit default swap costs from 2007 through August 24, 2026, showing major peaks around 2009, 2022, and 2026.
Oracle five-year CDS protection rose sharply into August 2026. Higher basis-point values mean protection against credit trouble costs more. Source shown in chart: Bloomberg Finance L.P.; Bravos Research. This is context, not a prediction of default.
A CDS spread is a warning light, not a countdown clock.

The signal becomes more persuasive when single-name protection costs, broad credit spreads, financing terms, utilization, and cash flow deteriorate together.

Executive summary · 1-minute read

The people lending money to Big Tech are getting more nervous.

Large technology companies have committed enormous sums to build AI data centers. Recently, the cost of protecting some of their debt against trouble has risen. Similar warning signs appeared before the major market declines that followed the late-1990s technology boom and the 2007 housing boom. That is why this matters now.

The protection is called a credit default swap, or CDS. Think of it like insurance for a lender: when the insurance becomes more expensive, concern about being repaid has increased. It does not mean a crash will happen tomorrow.

Credit can warn us that a storm may be forming. WealthVelocity's trajectory and Stage of Market analysis helps answer the more immediate question: are prices still holding, is this a normal dip, or is the market beginning to break?

Think of it as getting off a bus close to your stop. The goal is not to identify the exact market top. It is to avoid getting off several stops too early—or staying aboard until the market has carried you too far.

The accounting check

The $3 trillion figure is not all debt.

The widely cited total combines future leases, purchase obligations, construction commitments, debt, and other claims. These obligations can pressure future cash flow, but they should not be described as debt already outstanding.

01Debt

Borrowing already recognized on the balance sheet.

02Future leases

Signed commitments that may not yet have commenced.

03Purchase obligations

Contracted equipment, construction, power, or services.

04Cash-flow test

Whether utilization and revenue can support the fixed claims.

Member interpretation

A storm warning is not a shelter signal.

AI can transform the economy and still experience overinvestment. The relevant question is whether durable demand, utilization, and cash generation arrive before financing becomes too expensive or scarce.

The member report connects the six-signal credit dashboard to WealthVelocity's trajectory and market-stage interpretation. The first describes the weather system; the second helps members judge whether conditions still permit carrying on, whether an umbrella is warranted, or whether the evidence suggests it may be time to seek shelter and review exposure.

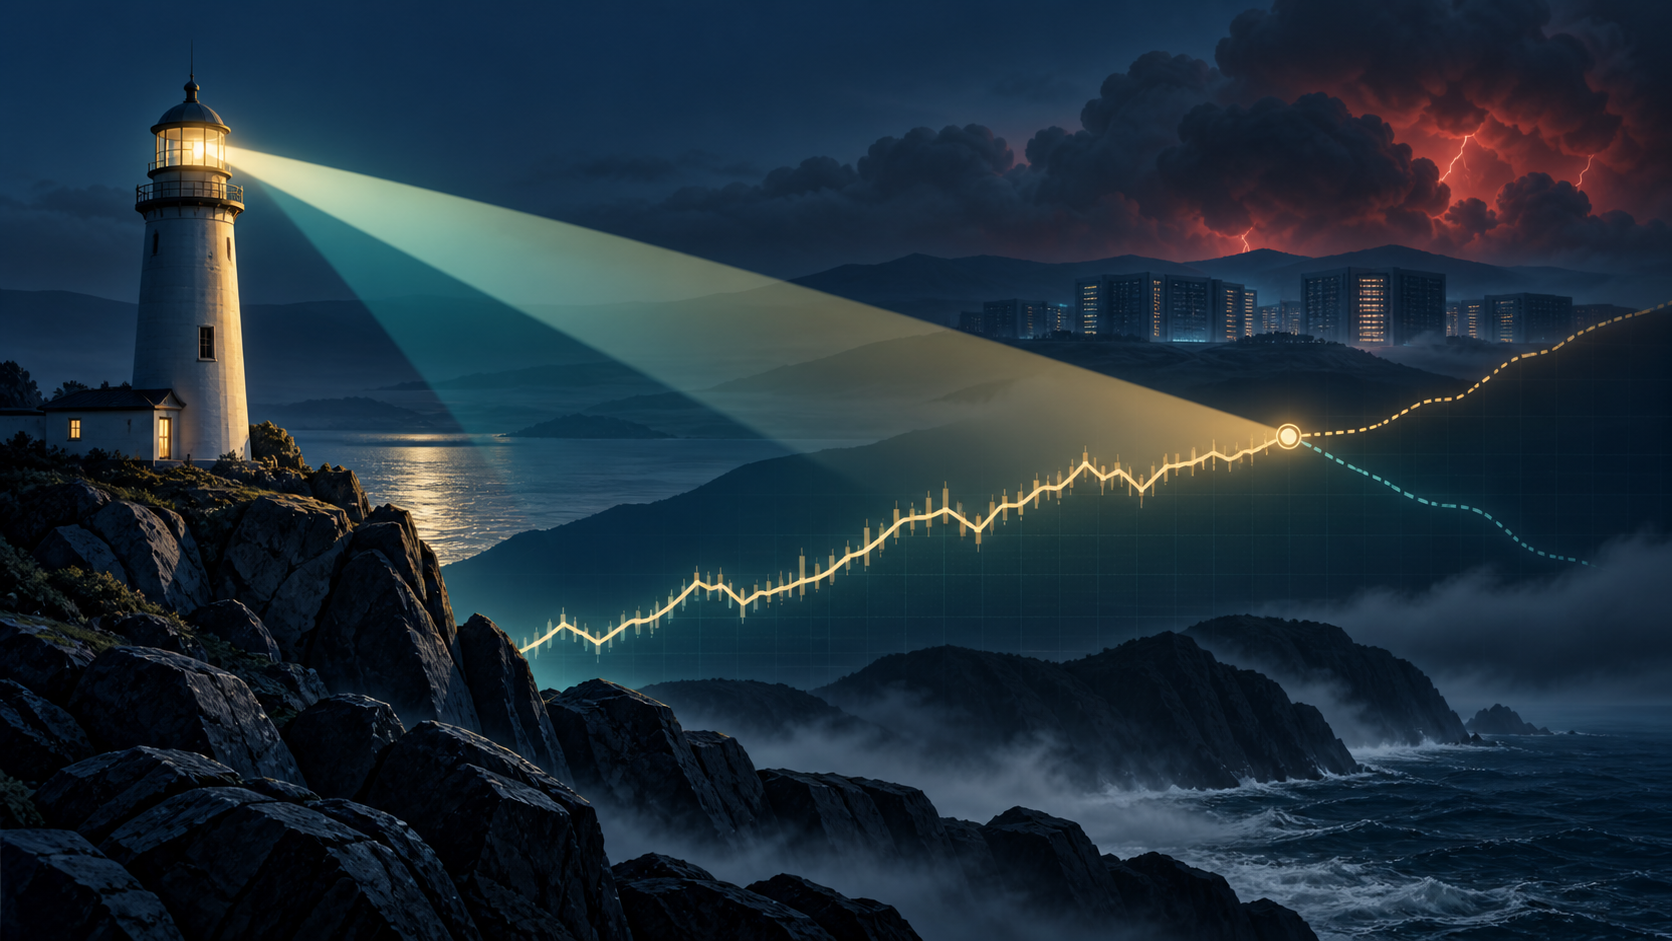
A lighthouse illuminates a market path while storm clouds gather over distant data centers, illustrating the difference between an early warning and a market-timing signal.
Credit can reveal the storm clouds. Trajectory and Stage of Market analysis help show whether price is still holding or beginning to break.

Member version

Use the full credit early-warning dashboard.

Separate a company-specific wobble from a broader change in the AI funding cycle.

Open Member Report