The Lighthouse Member Report

When Credit Stops Believing

Large technology companies have committed enormous sums to build AI data centers. Recently, the cost of protecting some of their debt against trouble has risen. Similar warning signs appeared before the major market declines that followed the late-1990s technology boom and the 2007 housing boom. That does not predict the same ending, but it explains why this deserves attention now.

Member thesis: credit is an early-warning system, not an oracle.

The AI buildout becomes vulnerable when fixed or contracted infrastructure obligations grow faster than durable cash generation while capital becomes more expensive or scarce.

Executive summary · 1-minute read

The people lending money to Big Tech are getting more nervous.

Large technology companies have committed enormous sums to build AI data centers. Recently, the cost of protecting some of their debt against trouble has risen. Similar warning signs appeared before the major declines that followed the late-1990s technology boom and the 2007 housing boom. That is why this matters now.

The protection is called a credit default swap, or CDS. Think of it like insurance for a lender: when the insurance becomes more expensive, concern about being repaid has increased. It does not mean a crash will happen tomorrow.

Credit can warn us that a storm may be forming. WealthVelocity's trajectory and Stage of Market analysis helps answer the more immediate question: are prices still holding, is this a normal dip, or is the market beginning to break?

Think of it as getting off a bus close to your stop. The goal is not to identify the exact market top. It is to avoid getting off several stops too early—or staying aboard until the market has carried you too far.
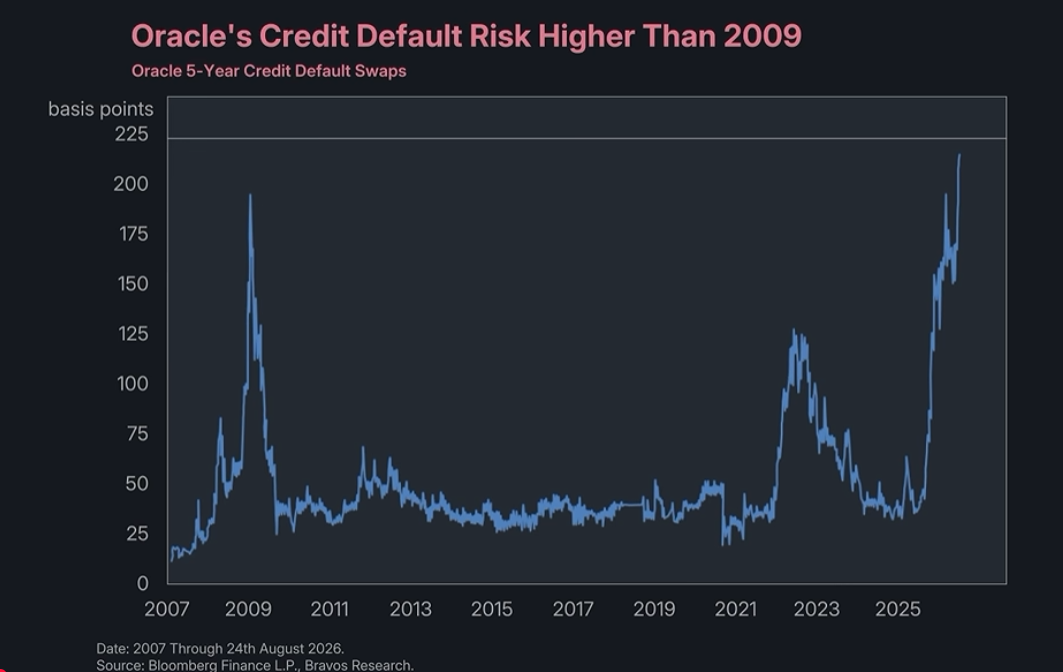

Line chart of Oracle five-year credit default swap costs from 2007 through August 24, 2026, showing major peaks around 2009, 2022, and 2026.
Oracle five-year CDS protection rose sharply into August 2026. Higher basis-point values mean protection against credit trouble costs more. Source shown in chart: Bloomberg Finance L.P.; Bravos Research. This is context, not a prediction of default.

CDS in plain English

Think insurance-like contract, not magic default forecast.

If a CDS spread is 150 basis points, the simplified annual premium is about 1.5% of the protected notional—roughly $150,000 on $10 million. Actual contracts can include standardized coupons and upfront payments.

What it can show

The market price of transferring an issuer's credit risk, how that price is changing, and whether lenders are becoming more cautious.

What it cannot prove

Imminent default, the next move in the stock, an industry-wide bubble, or an exact default probability without additional assumptions.

The accounting check

The $3 trillion figure is not all debt.

The widely cited total aggregates debt, leases that have been signed but have not begun, purchase obligations, construction commitments, and other future payments. Reuters reported approximately $1.09 trillion in future payments under leases not yet commenced for five large technology companies. S&P Global projected combined hyperscaler capital expenditure above $1.3 trillion by 2027 and noted the growing use of debt, equity, leases, and other financing.

These commitments matter because they create operating leverage and future claims on cash flow. But a commitment due over years is not equivalent to debt already outstanding today. The safer language is contracted and debt-like obligations, with the categories kept visible.

Six-signal dashboard

Require several lights to change together.

A single chart starts the investigation. Persistence, breadth, financing, and business evidence determine whether the warning is becoming systemic.

01Single-name CDS

Watch direction, persistence, and speed. A multi-week deterioration matters more than a one-day spike.

02Bond spreads

Compare issuer yields with similar-maturity government bonds and relevant peers.

03Broad credit

Use investment-grade and high-yield indexes to test whether concern is spreading.

04Financing access

Track coupons, maturities, deal size, covenants, and the quality of new funding.

05Cash flow and use

Compare capex, free cash flow, backlog quality, utilization, and revenue per compute dollar.

06Liquidity and rates

Higher rates can pressure infrastructure owners and the cash-burning customers expected to use capacity.

Signal interpretation

Green, amber, red.

StateCredit and fundingBusiness confirmation
GreenCDS stable or retracing; broad spreads contained; issuance clears.Utilization and cash-flow conversion improve.
AmberSeveral AI-linked spreads widen; funding arrives on weaker terms.Commitments outrun cash flow and equity leadership narrows.
RedSingle-name and broad spreads widen; deals are pulled or sharply repriced.Funding stalls, utilization falls, and stress spreads to suppliers or customers.

Current liquidity update

The rate backdrop changed as new inflation data arrived.

As of September 13, 2026, August inflation had revived the possibility of a Federal Reserve rate increase at the September 15–16 meeting. The rate backdrop had shifted from earlier expectations and remained a live part of the signal.

The point is not to predict the meeting. It is to keep liquidity as a live dashboard input. Higher policy rates can tighten both sides of the financing loop: builders face higher costs, while customers may find new capital more expensive.

From warning to direction

A storm warning is not a shelter signal.

Credit, liquidity, valuation, and macro conditions are important meta-information. They can tell us that a storm is brewing, but not precisely when the rain will reach us or when it is time to go indoors. Acting too early can be costly; waiting until the damage is obvious can be too late.

That is where WealthVelocity's trajectory and Stage of Market analysis comes in. The more immediate questions are: what is the market doing now, what direction is the evidence pointing, and is the price action still an ordinary dip, becoming a correction, or developing into a full-market dump?

Members receive prepared directional context across exchanges, major indexes, sectors, and individual stocks. Credit and macro conditions describe the weather system. Trajectory and market stage help members judge whether it is still reasonable to carry on, whether an umbrella is warranted, or whether the evidence suggests it may be time to seek shelter and review market exposure.

The distinction matters because risk awareness without a decision horizon is incomplete. Trajectory and market stage address the state of the market now versus what appears to be developing next. Neither guarantees the next move, but together the signals provide a more useful basis for acting before a decline becomes obvious.

Another way to frame the goal is getting off the bus closer to your stop. A broad macro warning can lead an investor to get off several stops too early and walk for miles. Waiting for an obvious collapse can carry the investor well past the intended stop. Trajectory and market stage are designed to narrow that decision window by showing whether current market behavior still has support or is beginning to break. The objective is not a perfect exit at the exact top; it is a better-informed decision closer to the change in conditions.

A lighthouse illuminates a market path while storm clouds gather over distant data centers, illustrating the difference between an early warning and a market-timing signal.
Credit can reveal the storm clouds. Trajectory and Stage of Market analysis help show whether price is still holding or beginning to break.

Reference packet

Source material and verification.

CDS mechanics were checked against CFTC, BIS, and SEC descriptions; the leading-indicator framework against Federal Reserve research; AI financing against S&P Global, Reuters, Axios, and FactSet; and the September rate backdrop against the Federal Reserve, San Francisco Fed, and Associated Press.