Is the market trending, correcting, rotating, exhausting, or breaking down?
Why predictive models
Useful prediction starts with disciplined context.
WealthVelocity uses predictive modeling as a practical research discipline: filter noisy information, recognize the current market regime, and give members a clearer read on trajectory, risk, and timing.
A model is only useful when it helps a real decision.
The point is not to impress members with equations. The point is to make market context more usable: where strength is building, where a pullback remains normal, where momentum is becoming exhausted, and where the evidence has changed enough to reconsider a position.
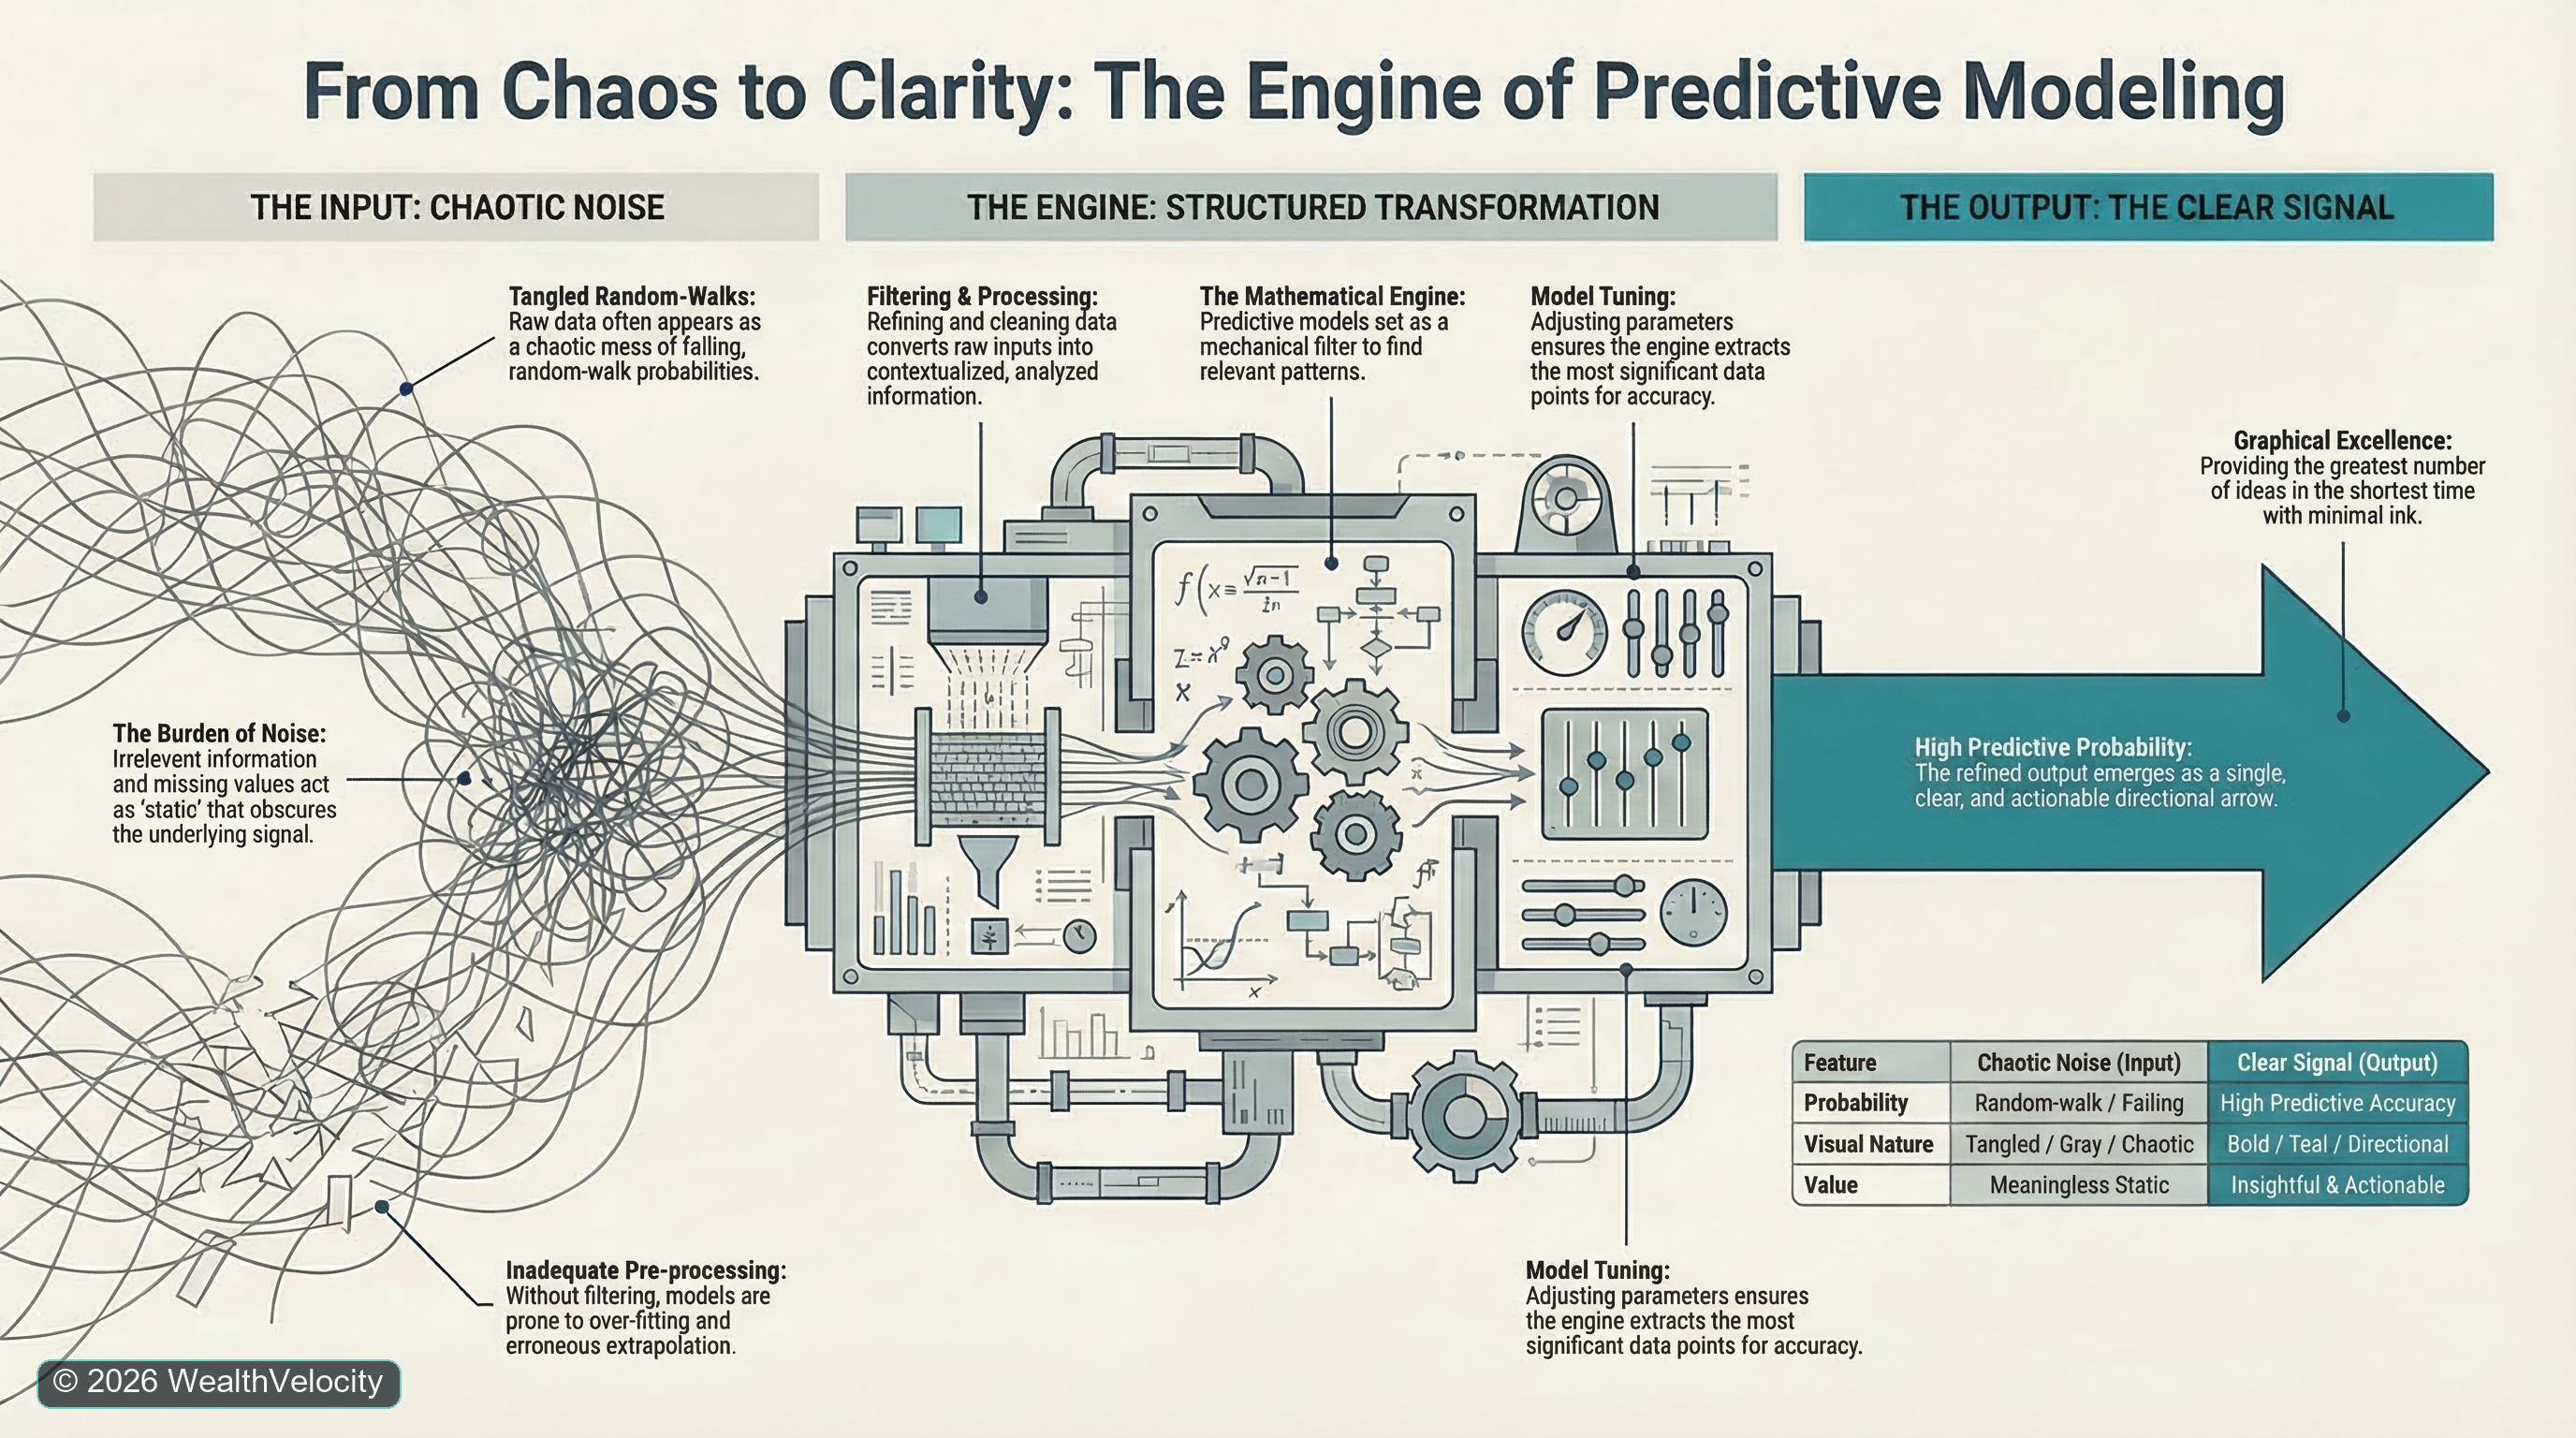
Signal from noise
The market is flooded with charts, opinions, and automated slop.
Everybody likes a reliable prediction. That desire is not new. Traders have looked for outside confirmation for more than a century because financial markets are complex, emotional, and expensive to navigate alone.
The problem is that modern investors now face an overwhelming amount of low-quality output. A standard algorithm pointed at widely available information can look sophisticated while still saying very little. It may summarize the same public data everyone else already sees, or it may overreact to patterns that do not hold up when conditions change.
WealthVelocity's philosophy is different. The work begins by pre-processing the market before the member ever looks at a blank chart: country strength, sector leadership, stock trajectory, pivots, exhaustion signals, condition changes, and risk lines are organized into a clearer decision context.
Market regimes
There is no single perfect indicator because markets do not stay in one condition.
One common mistake is treating a market tool as universal. An indicator can work well in a trending market and perform poorly when the broader market is range-bound, choppy, or losing leadership.
That is why regime context matters. Trending markets, corrective pullbacks, exhaustion moves, broad sector rotation, and structural deterioration should not all be judged by the same static rule.
A useful model changes emphasis as the market condition changes.
The most valuable insight is often the shift from healthy pullback to changed setup.
The output should support review levels and action, not vague confidence.
The indicator family tree
The earliest indicators began with price structure.
Support, resistance, and trendlines are real and useful. They are also lagging by construction: a level becomes credible only after price reaches it and reacts, and a trendline needs multiple pivots before it can be drawn with confidence. The same logic works on intraday, daily, or weekly candles.
These are the primitive forms from which channels, flags, and many other chart patterns evolved. Volume-based tools added another dimension—Joe Granville's on-balance volume asked whether cumulative volume confirmed the price move. Later indicators such as Bollinger Bands introduced a statistical frame around price. Each generation sought the same thing: a usable edge for the investor.
Price levels→Trendlines→Patterns & channels→Volume & statistics
Evergreen example
Price structure comes first
Intraday · Daily · Weekly
Modern trend-following example
Supertrend depends on the regime
Bullish Bearish
The regime problem
A trend indicator is only as useful as the trend it is given.
Retail trend indicators are weakest where investors need the most help: before the trend is obvious. Once price is moving cleanly, support, resistance, trendlines, moving averages, and Supertrend often agree. In a cyclical market, however, trend-following rules can reverse again and again.
In WealthVelocity's review of weekly Dow Jones Industrial Average candles from 1900 through 2025, the market was classified as cyclical 69% of the time, bullish 20%, and bearish 11%. That 126-year review explains why a tool designed primarily for trends can be unreliable through most market conditions.
- Cyclical
- 69%
- Bullish
- 20%
- Bearish
- 11%
Over very long periods, equity prices also carry an upward nominal bias: inflation and the declining purchasing power of the dollar tend to lift the quoted share-price scale. That long-run bias should not be confused with a continuously tradable trend.
Modeling Discipline
What We Avoid
Impressive backtests can hide fragile thinking.
- Overfitting
- A model can memorize the quirks of past data and fail when new market samples arrive.
- Single-tool thinking
- No one model or indicator works best for every market problem.
- False certainty
- Markets are adaptive systems, so the useful goal is better probability and trajectory context.
Theory versus application
High-level mathematics still needs domain judgment.
Pure theory can describe many physical systems elegantly, but markets are not static physical systems. They include liquidity, psychology, policy, positioning, incentives, news, institutional behavior, and feedback loops.
That is where a quantitative engineer earns the title. The work is not simply finding a formula. It is knowing which data matters, which model is appropriate, which assumptions are fragile, and which output is actually useful for the investor's next decision.
WealthVelocity does not ask members to trust a black box. It uses predictive models to keep the evidence organized, the market regime visible, and the member's next decision tied to observable conditions.